What’s on the market now:
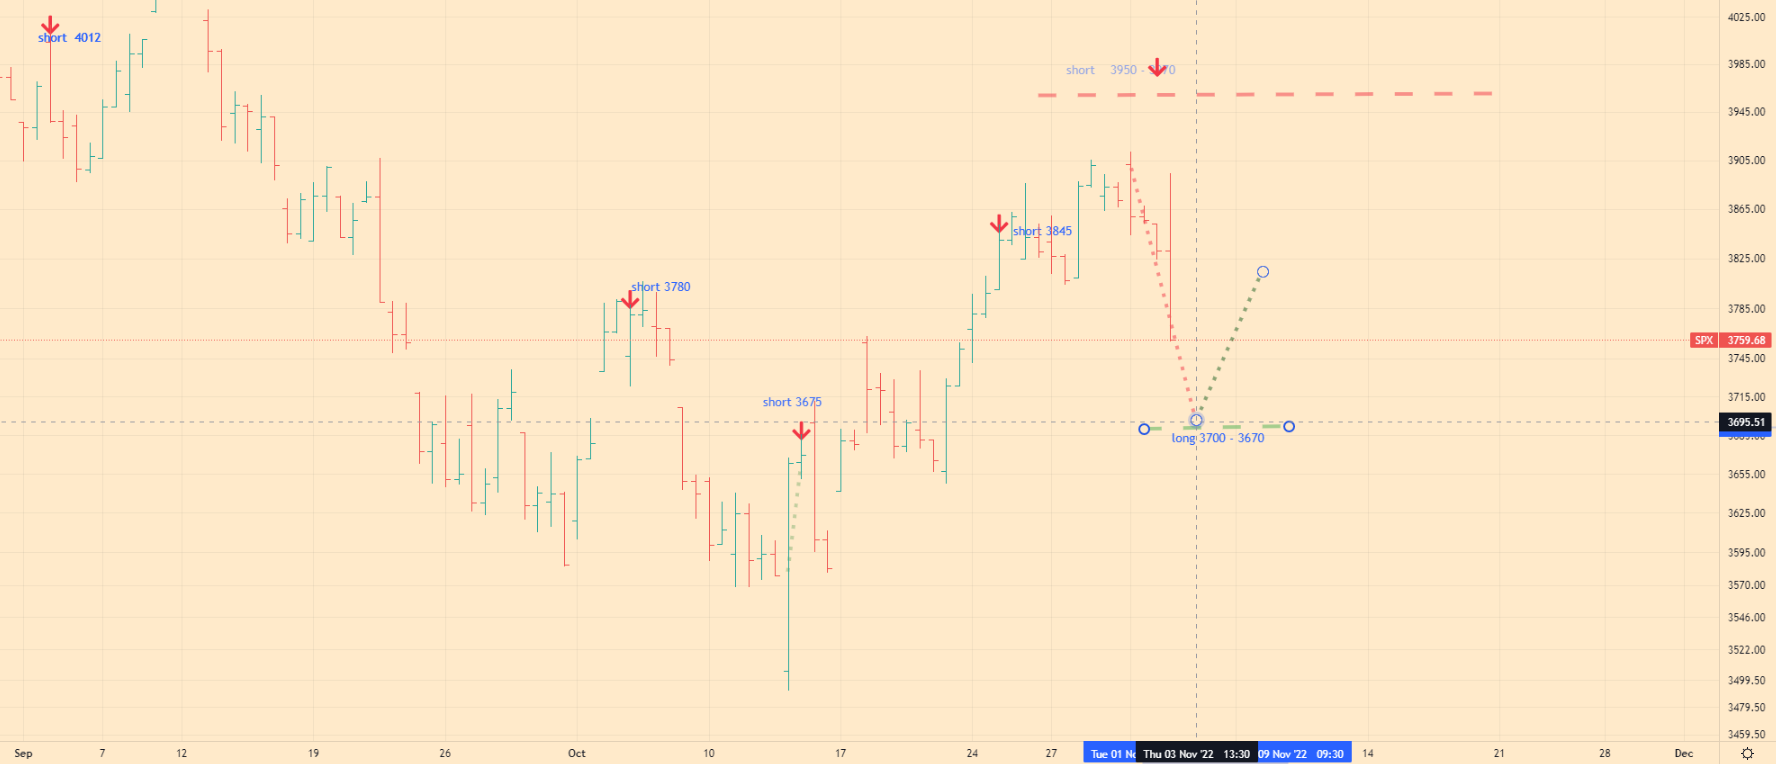
Today the index is trading at 3759. Yesterday the market made the last attempt to grow, which was broken, to my regret. As I wrote earlier, if this attempt to increase the index is unsuccessful, then the market will drop sharply to the level of 3700 and today I expect this fall to continue with a bottom at 3680-3660.
What today:
Today, I am waiting for the index to try and drop to the level of 3700-3660. However, if this attempt is broken, then we will see a slight pullback of the market to the level of 3810-3840. Where can I look for a place to open short positions.

Here are my trading recommendations for today 11/03/22
What I recommend:
- If you want to open short:
Short positions are possible on a pullback from the 3800-3830 level, limit your losses.
- If you want to buy:
Long positions are possible from the 3660-3700 level, limit your losses.
- If you are not in the market:
Long positions are possible from the level of 3700 – 3660. Limit your losses. If you want to open a short position, it is better to do it from the level of 3830.
Give me thumbs up. Also remember to contact me in 2 or 3 days for further trading advice. If you have any questions about analytics and my trading logic, then I recommend that you read the FAQ section. Also share a link to my blog, it will greatly help in its movement.
Follow me on Twitter to stay up to date with the S&P 500. Also visit page about me to get to know me better. If you like the content of my blog, you can make a donation to support the blog.
I don't understand your recommendations.
When I make a buy or sell recommendation, what I really mean is that the market will peak when a trade can be made.
Attention: my recommendations are current at the time of publication. The trading situation may change during the day, and it is possible that the index will not reach its ideal price.
If you are faced with such a situation, then you need to deal with it yourself. Since it refers to trading methods, but not to analytical ones.
Where is the index going now?
In my analytics, I use the “buy low and sell high” technique. This means that the market always goes to the level at which I recommend selling. This is also true for the reverse situation, when the index falls, then I will recommend that you buy it at the bottom.
To better understand the direction of the market and the purpose of the market, you can also focus on the post titles.
What is your analysis based on?
I mainly use volume analysis from various exchanges in Europe, Asia and the USA. I also use various technical indicators a lot, but deliberately do not publish them. So that you can better understand what I'm talking about. It is this approach that allows me to find peaks and valleys in the market.
Why don't you buy and sell with the trend?
Buying with a trend is a trade that is always against buying and selling at the bottom or top. I do not use such trading on my blog pages. As far as trend trading methods are concerned, each trader should do it on their own.
Perhaps I will create a trading telegram channel, where there will be practical intraday trading.
Do you trade?
Yes, and that's why I myself need a daily review.
Visit my trade page.
How can I help you?
If you like my content, you can place an indexed link on your site. Or share my investment blog in your trading community, it will help me a lot.
My blog is read all over the world. From Malaysia, Laos, China, Europe and North and South America. I would be happy to help any trader who is trying to understand the game of the stock exchange. If you want to know more about me, visit the about me section.
I have a question?
If you have a question or suggestion, you can contact me via Twitter or email.