S&P 500 Index Analytics on 08/21/22:
Today we’re here to talk about the S&P 500 Index.
What’s on the market now:
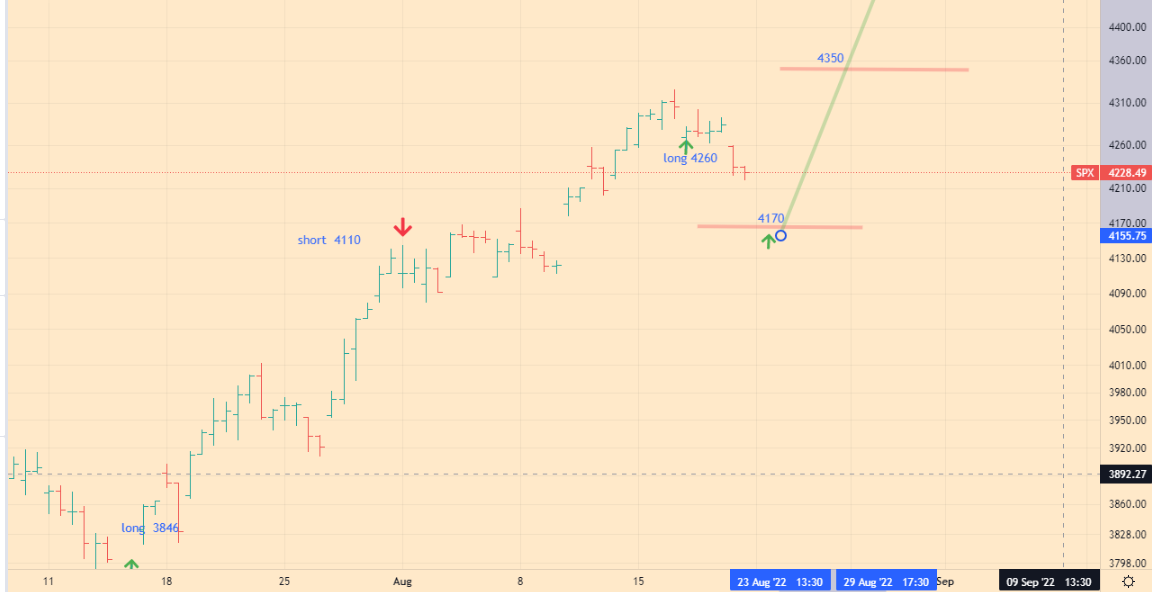
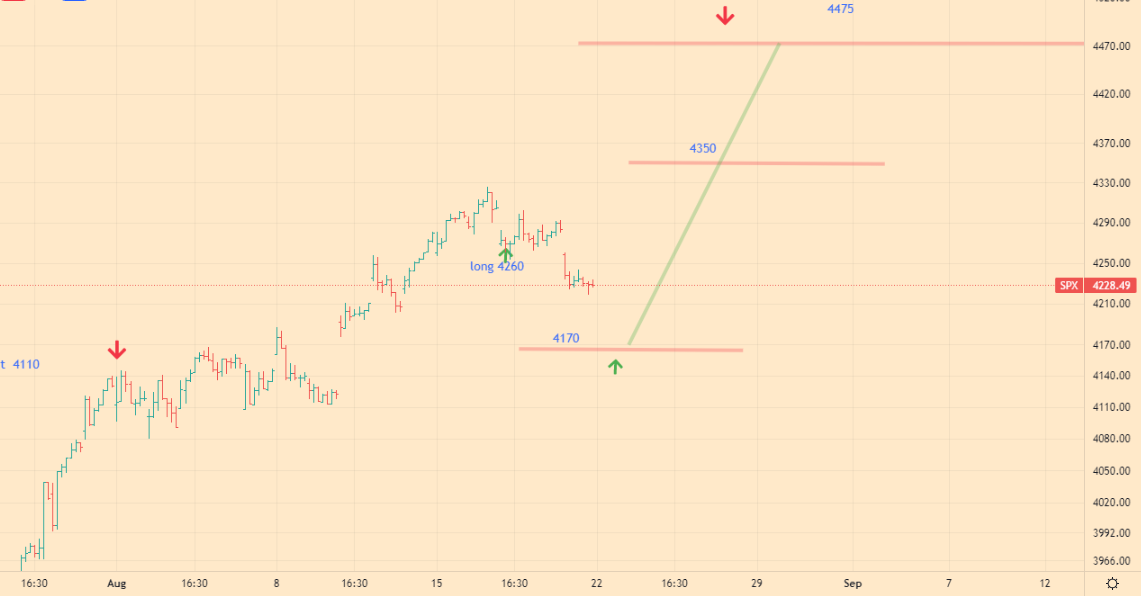
Today the index is trading at 4228. As I said earlier, the market is developing a correction caused by profit taking. Here is a link to the idea. As I expect the current correction will take 5-6 trading days, And its local bottom will be at the level of 4170. I believe that there is no reason for concern and for a sharp collapse of the index. However, we can expect a decline to the 4170 – 4140 zone. The movement will stabilize and then the market will attempt to rise to the level of 4350 – 4475.
What I’m looking forward to today:
I expect the index to further decline to the level of 4170 – 4140.
Here are my trading recommendations for today 08/21/22
What I recommend:
- If you want to go short:
Short positions are prohibited. - If you want to buy:
Buying are possible only at the local day of the current correction. Buy from level 4170 – 4140. Limit your losses. - If you are not in the market:
If you want to buy, you’d better place your buys at 4170-4140, limit your losses. From the level above 4350 short positions are possible.
Follow me on Twitter to stay up to date with the SPX 500. Also visit my About page to get to know me better. Also remember that I first publish my predictions on my investment blog on this site, with a publication on Twitter, and only after 1-2 days, then I publish them in Trading View and other sites. If you like the content of my blog, you can make a donation to support the blog.
Also remember to contact me in 2 or 3 days for further trading advice.